Summary

This project utilizes Python, API’s and JSON traversals to try and answer a fundamental question: “What’s the weather like as we get closer to the equator?”
Assigning 1,500 random Latitude and Longitudes, I utilized the Python CitiPy library to find the city closest to the Lat/Lon (dropping all duplicates) to get a listing of over 600 cities. I utilized OpenWeatherMapAPI to get the weather for the cities (dropping cities with no data) to create a dataframe of weather information for over 500 cities.
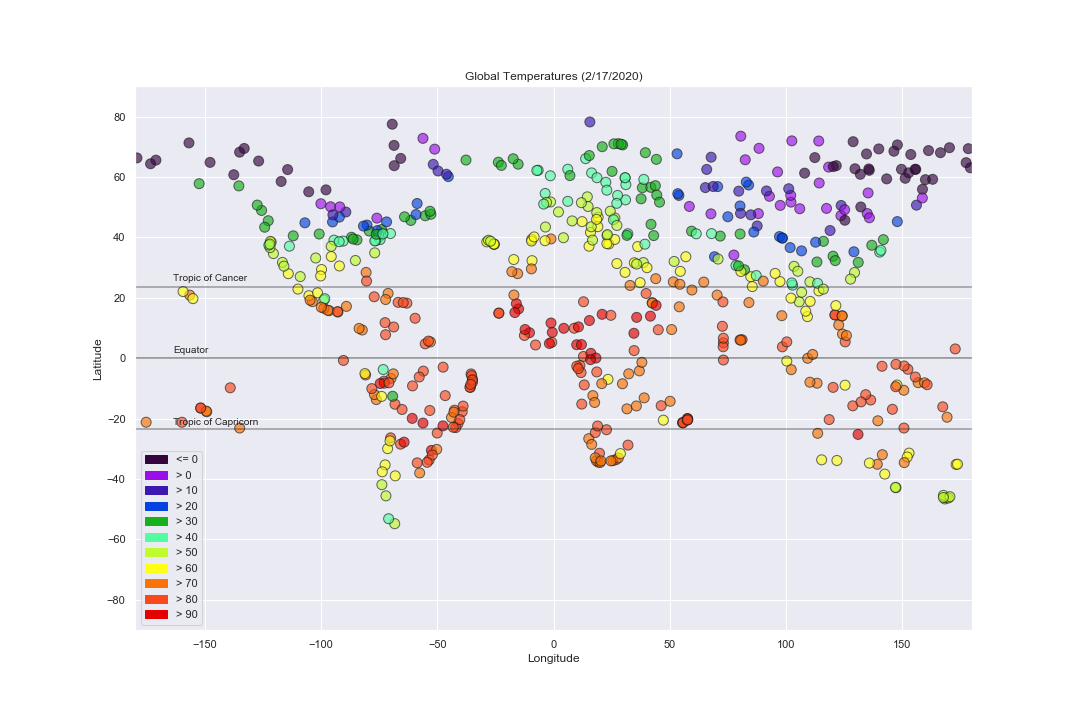
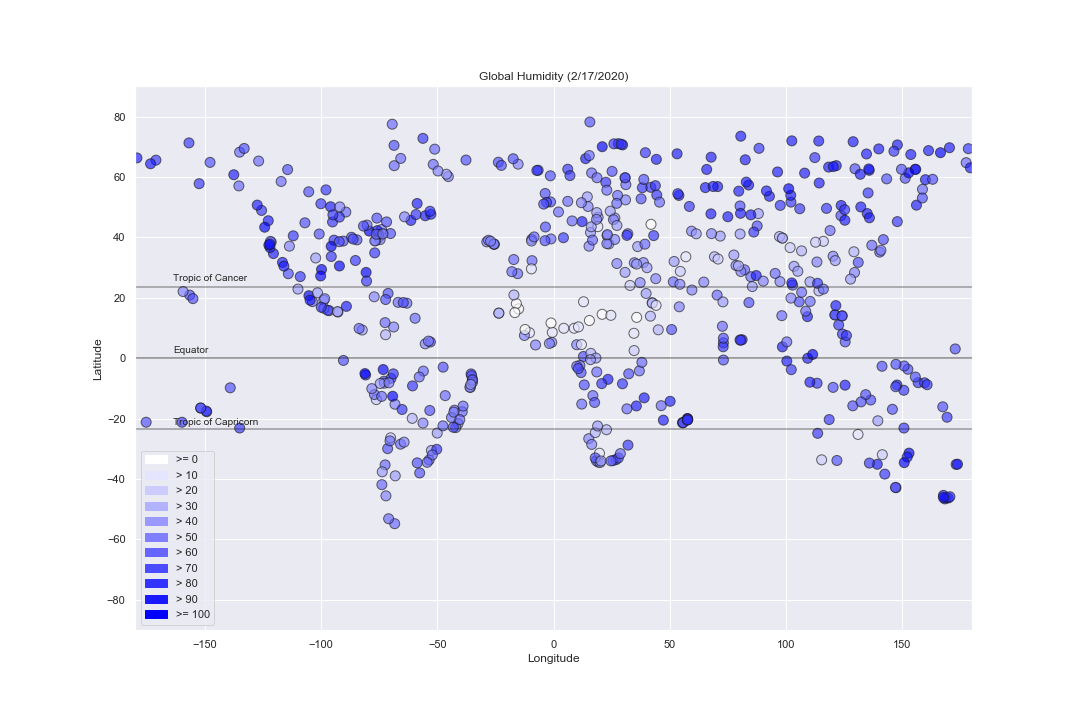
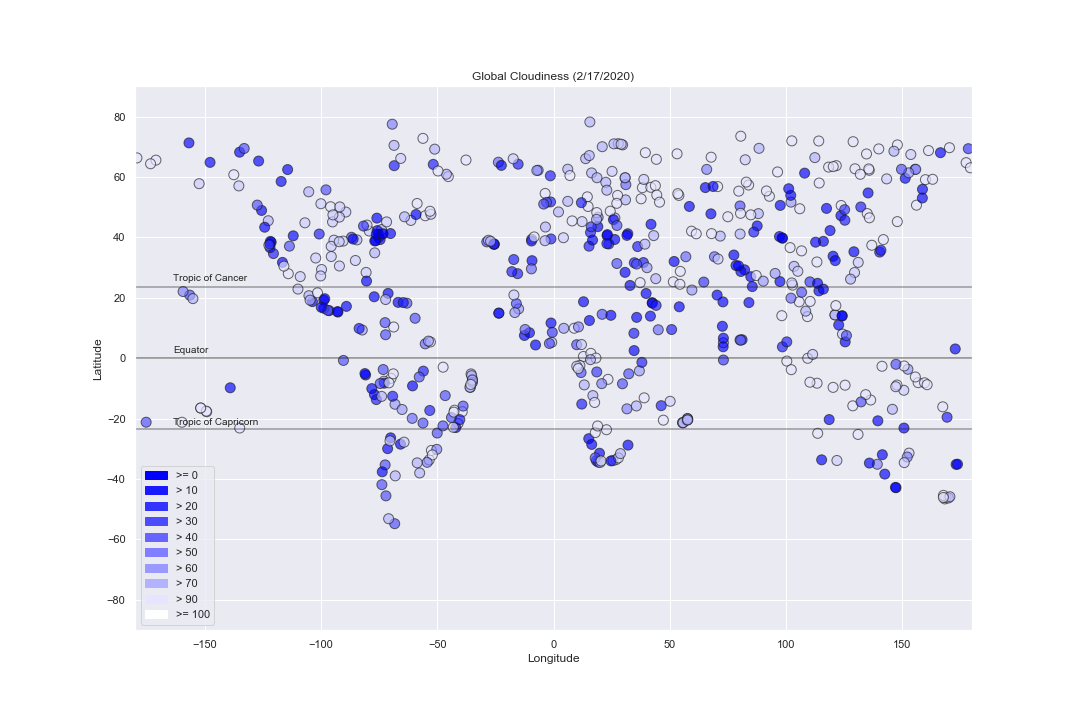
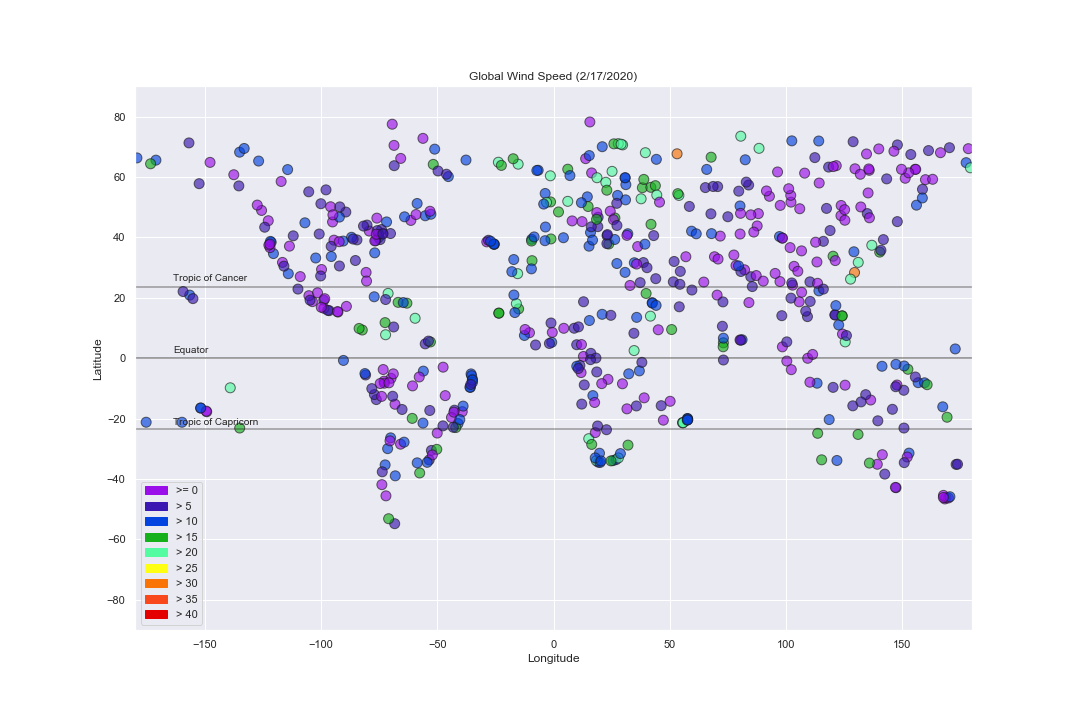
The dataframe is saved to CSV and the data is analyzed across the three climate zones (Tropical Zone, Temperate Zone, and Polar Zone). I utilize MatplotLib scatter plots to showcase the relationship between latitude and temperature/humidity/cloudiness/wind speed. I plotted graphs of:
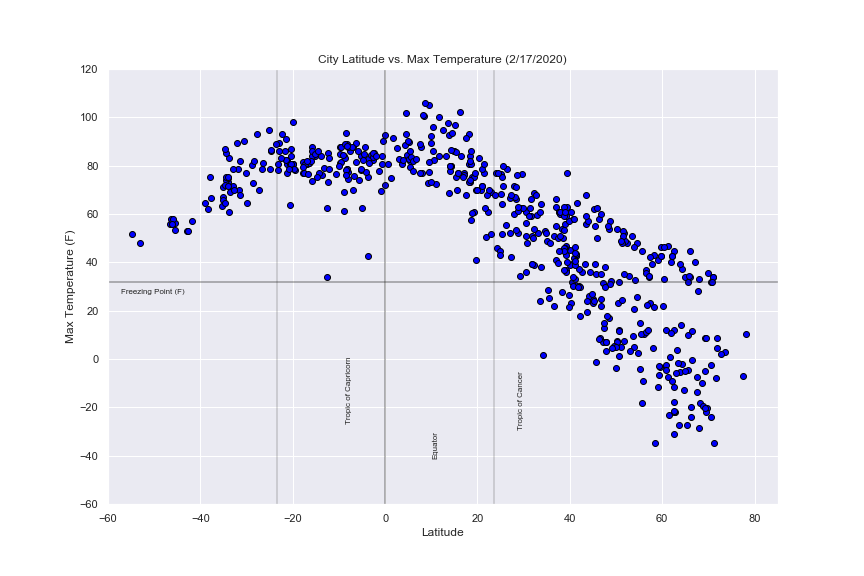
- Temperature (F) vs. Latitude
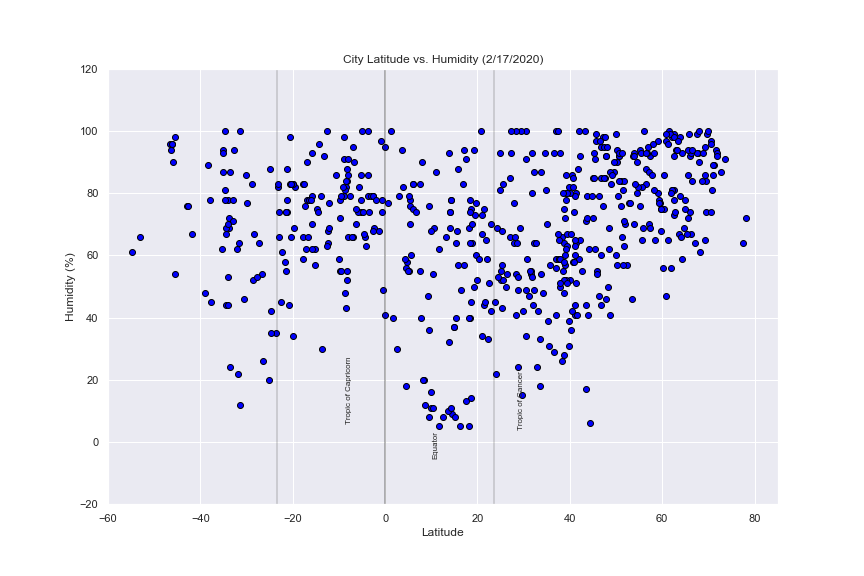
- Humidity (%) vs. Latitude
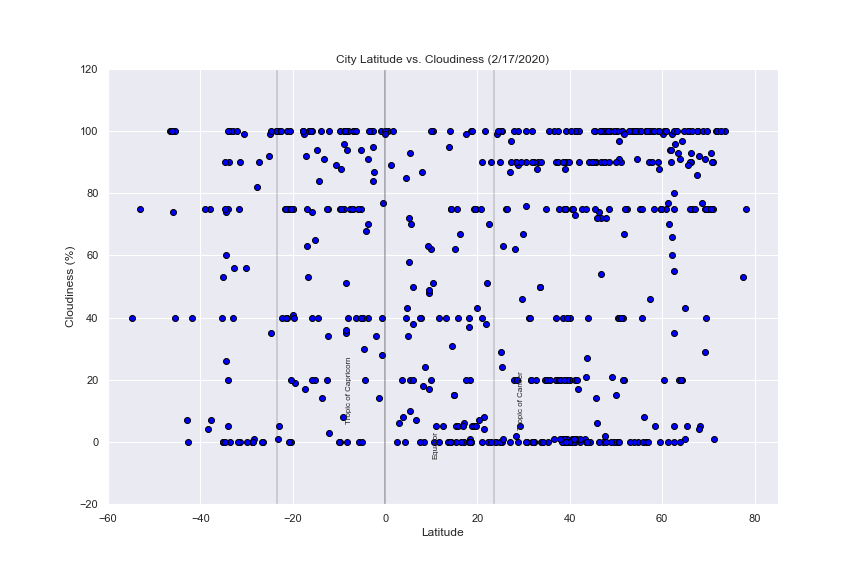
- Cloudiness (%) vs. Latitude
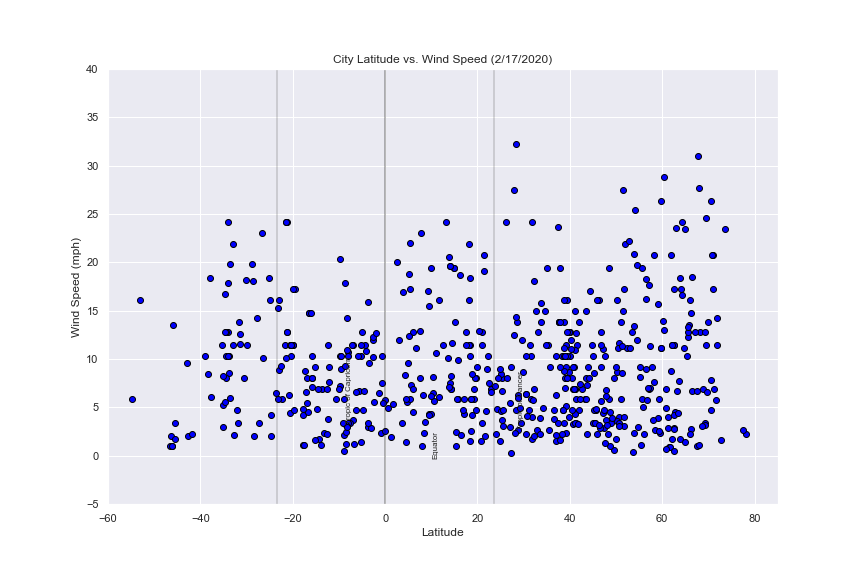
- Wind Speed (mph) vs. Latitude
Visualizations